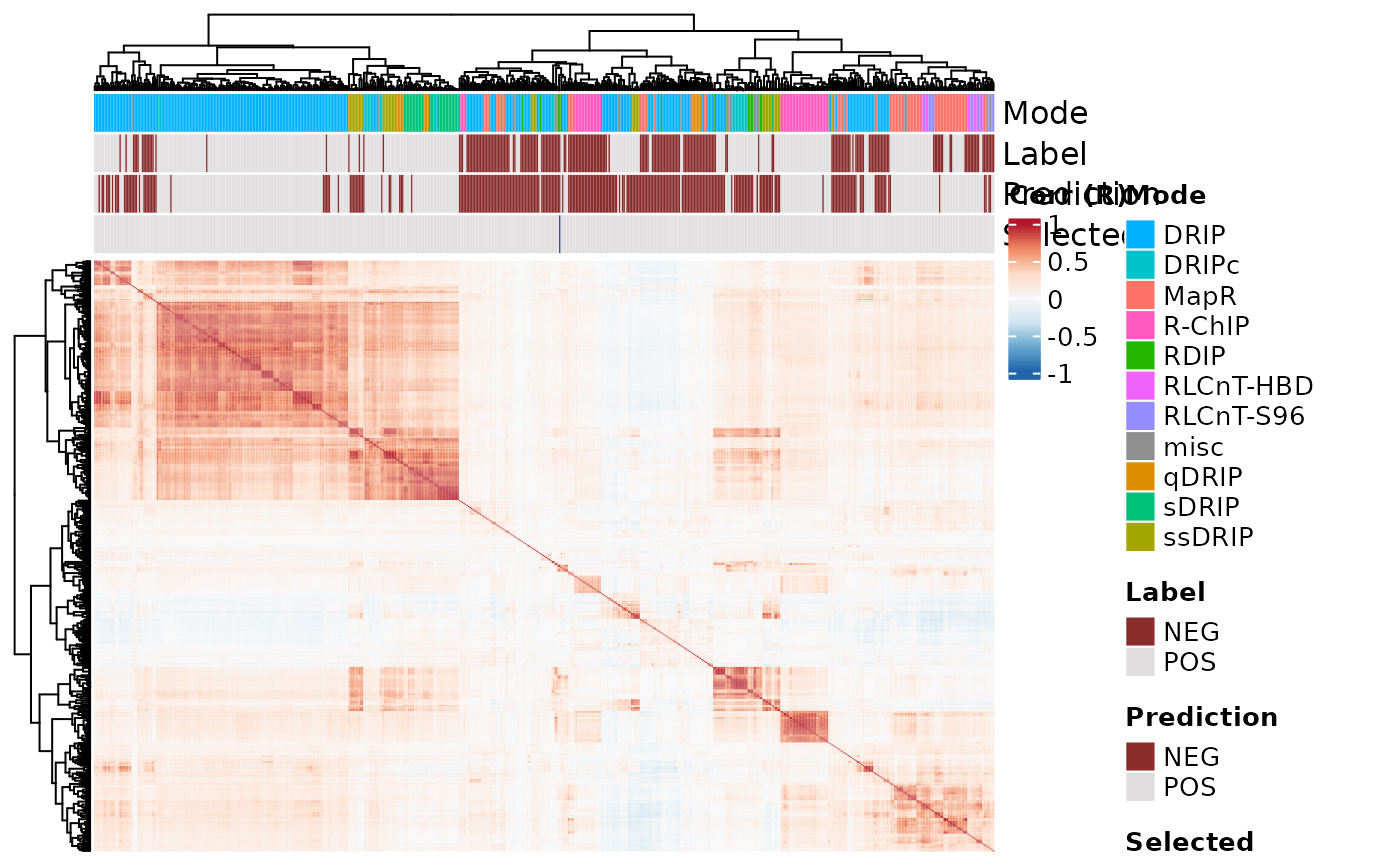
Plots a heatmap to visualize the pairwise Pearson correlation matrix generated via corrAnalyze.
corrHeatmap(object, returnData = FALSE, complex = TRUE, ...)Arguments
- object
An RLRanges with corrAnalyze already run.
- returnData
If TRUE, plot data is returned instead of plotting. Default: FALSE
- complex
If TRUE, ComplexHeatmap::Heatmap will be used for plotting. Otherwise, pheatmap::pheatmap is used. Default: TRUE
- ...
For internal use.
Value
A plot object or plotting data (if returnData is TRUE).
Examples
# Example RLRanges data with corrAnalyze() already run.
rlr <- readRDS(system.file("extdata", "rlrsmall.rds", package = "RLSeq"))

# Corr heatmap
corrHeatmap(rlr)
#> see ?RLHub and browseVignettes('RLHub') for documentation