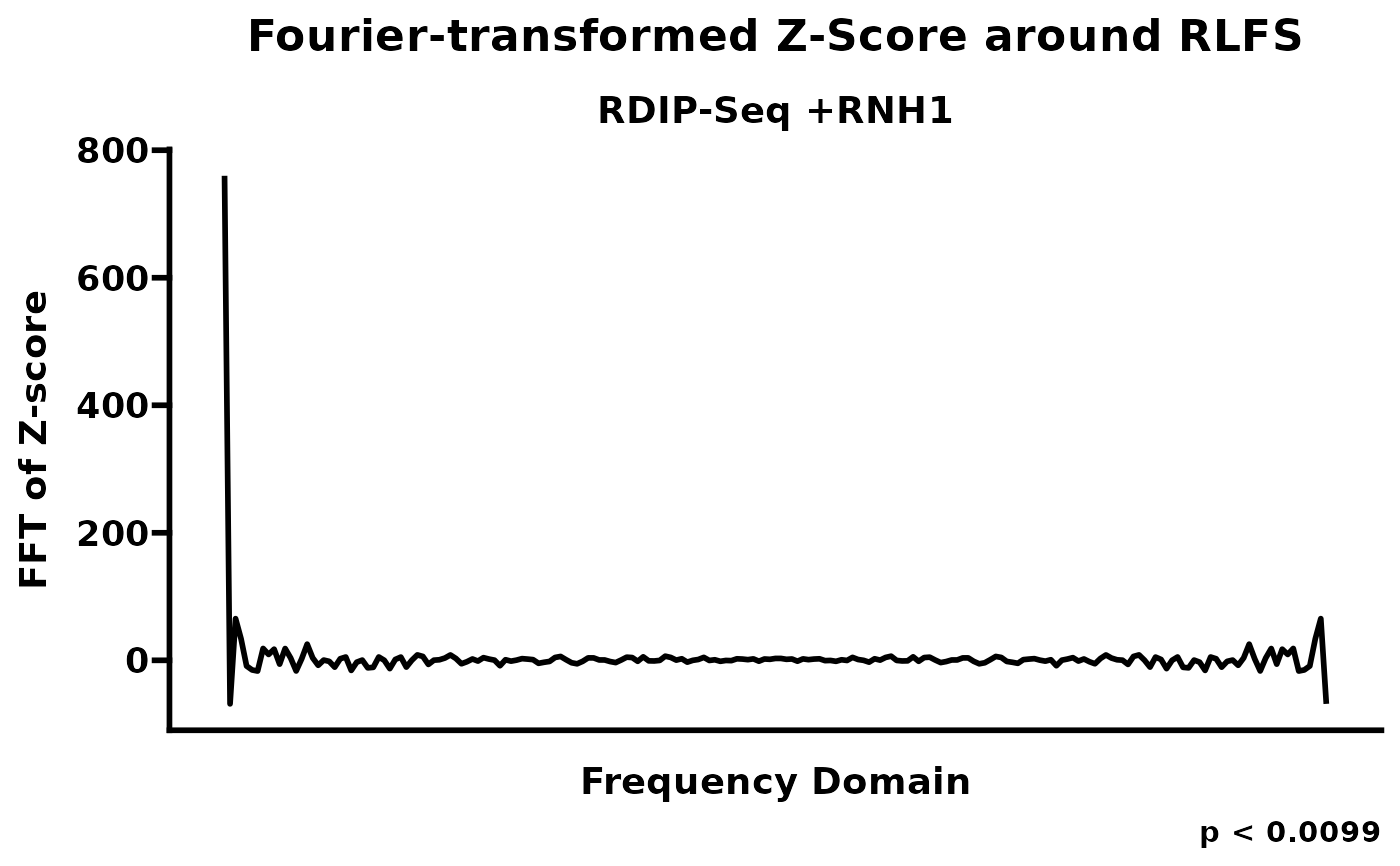
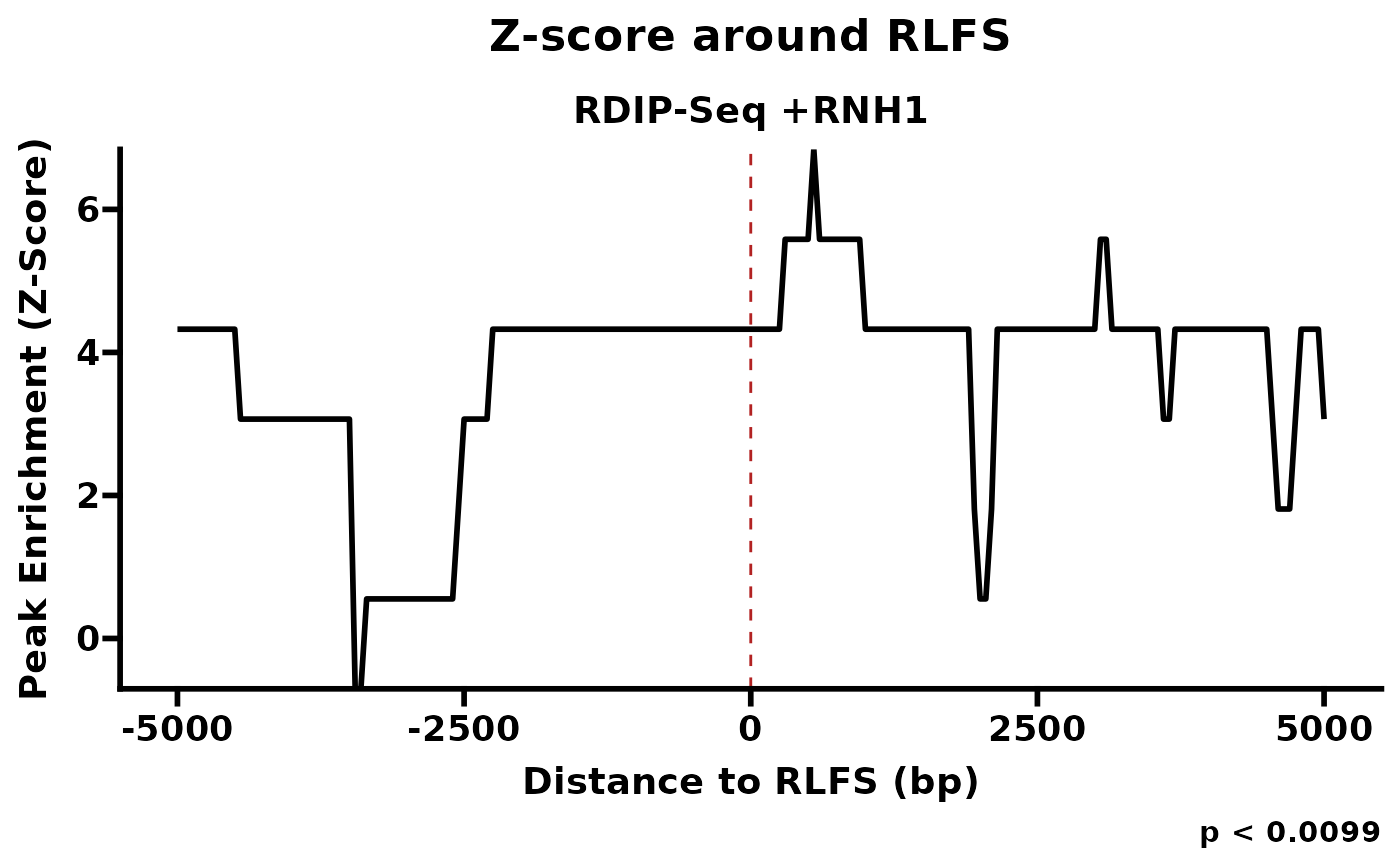
Plots the results of the R-loop-forming sequences (RLFS) analysis. The plot is a metaplot of the Z score distribution around RLFS with the p value from permutation testing annotated. See also analyzeRLFS.
plotRLFSRes(object, plotName = NULL, fft = FALSE, ...)Arguments
- object
An RLRanges object with analyzeRLFS already run. Alternatively, can be the RLFS results object from an RLRanges (from
rlresult(object, "rlfsRes")).- plotName
A Sample name used for plotting. If blank, the RLRanges
sampleNamemetadata entry is used (see RLRanges).- fft
If TRUE, the Fourier transform of the Z-score is plotted instead. Default: FALSE.
- ...
Additional parameters passed to ggplot2::ggplot.
Value
A ggplot object. See also ggplot2::ggplot.
Examples
# Example RLRanges dataset with analyzeRLFS() already run.
rlr <- readRDS(system.file("extdata", "rlrsmall.rds", package = "RLSeq"))

# Plot RLFS res
plotRLFSRes(rlr)


# Plot the Fourier transform instead
plotRLFSRes(rlr, fft = TRUE)
# Plot the Fourier transform instead
plotRLFSRes(rlr, fft = TRUE)